User Guide
Asset Management
The asset management function provides all registered transformer information in the form of a table chart. Users can check the list of transformers efficiently and search for transformers with specific conditions. The data management function allows users to conveniently manage their DGA data.
Asset
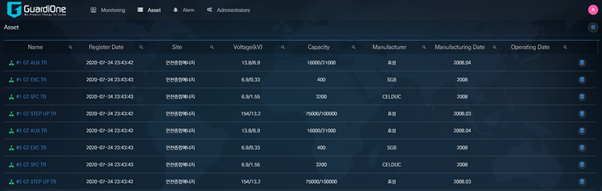
Transformer Information List: The contents of the table include the following information for integrated asset management: transformer name, register date, site, voltage(kV), capacity, manufacturer, manufacturing date, and operating date. - By entering specific information in each column, users can search for corresponding transformers. Users can return to the entire asset list by clicking the reset button. - Clicking the name of a transformer will display the analysis summary page of the corresponding transformer. - Clicking the database icon of a transformer will display the DGA data list.
DGA Data Management: The DGA data list includes data acquisition date, H2, C2H2, C2H4, C2H6, CH4, CO, CO2, O2, N2, C3H8, H2O, TDCG, Acid, DGA analysis company, filtering date for both transformer DGA and OLTC DGA. In addition, users can efficiently alter data through the provided data management functions.
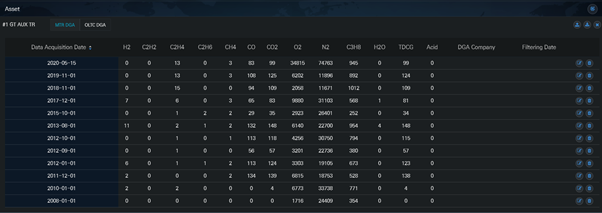
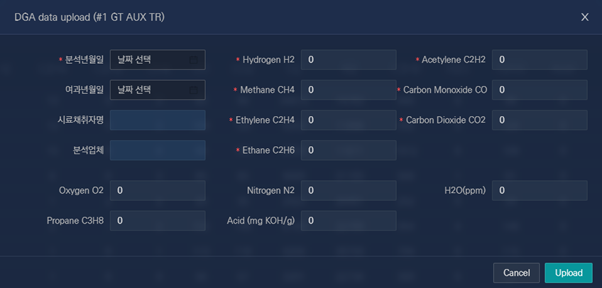
- Data upload: The data input window will pop up when the user clicks the upload icon. Users can manually enter data in the data entry window. The information such as data acquisition date, H2, C2H2, C2H4, C2H6, CH4, CO must be entered for the software to operate correctly.
- Data update: The data input window will pop up when the user clicks the update icon, allowing the user to modify the data.
- Data delete: Specific data can be deleted by clicking the delete icon.
- Data download: Users can download all DGA data for a specific transformer. When you click the download icon, you can download data in csv file format.
Alarm
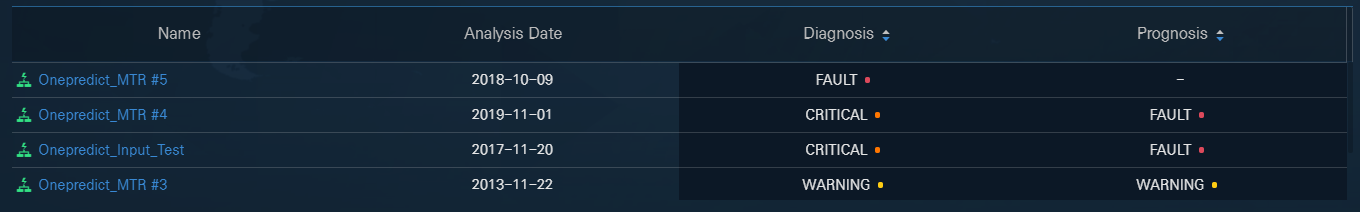
If the diagnosis or prognosis status of a transformer is worse than the caution level, the transformer will be displayed in the alarm table.
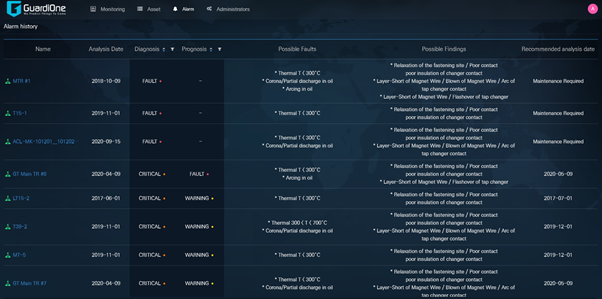
The Alarm table includes analysis date, diagnostic status, prognostic status, corresponding possible faults and findings through gas value comparison, and recommended analysis date*
* Recommended analysis date: Fault – Maintenance Required / Critical – One month after analysis date / Warning – Three months after analysis date / Caution - Six months after analysis date
- The default ordering of transformers is from fault to normal, based on diagnosis results.
- User can change the sorting sequence by clicking the upper and lower triangle icons in diagnosis or prognosis.
- Clicking the name of a transformer will display the analysis summary page of the corresponding transformer.
Power Substation Monitoring
This menu provides spatial view of user location, all registered transformers, summary of all transformers status, alarm rate, and latest alarms.
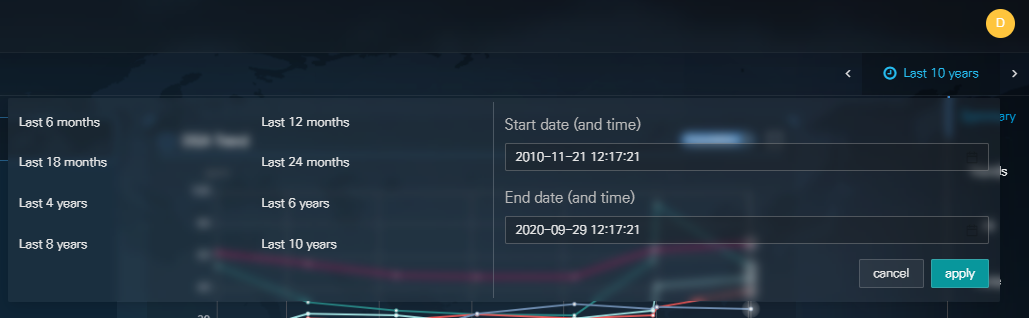
(1) Time Setting: The user can check and change the time zone using the time setting function. The time setting function allows users to change the time and dates. Once the setting is changed, all pages will follow the new setting.
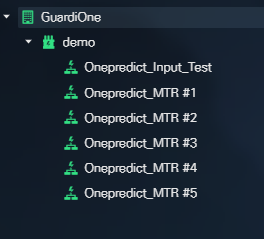
(2) Asset Tree Structure: A tree-like panel represents the registered transformers. Clicking the name of a transformer will display the analysis summary page of the corresponding transformer.
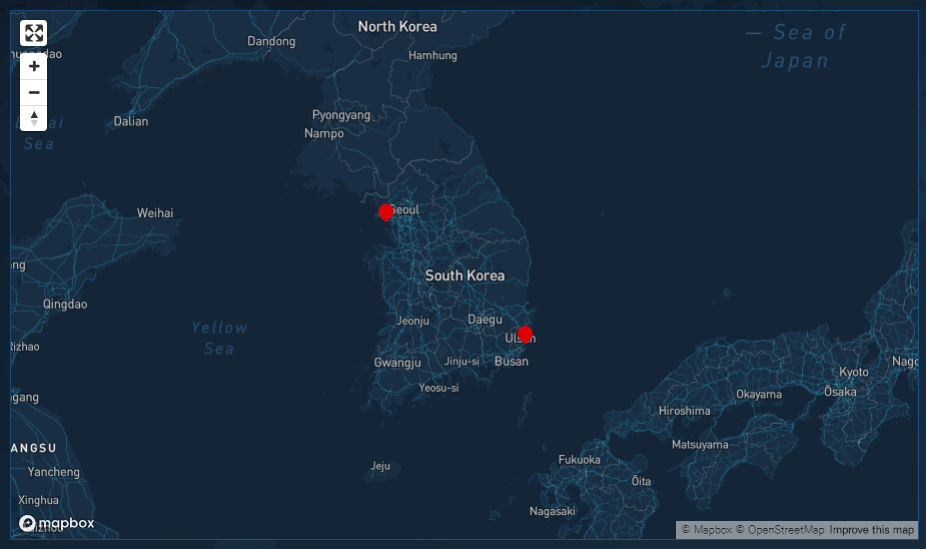
(3) Spatial View: The panel shows the geographical distribution of transformers locations The area marked in red point is where the transformer is installed. As a default first display, the area marked in red point is where the transformer is installed. The user can zoom in and out from the world and specific city map through the mouse wheel button or by clicking the  ,
,  icon. The user also can click the
  ) icon to maximize the map to a full-screen and can click the
  icon to reset the map to point north.
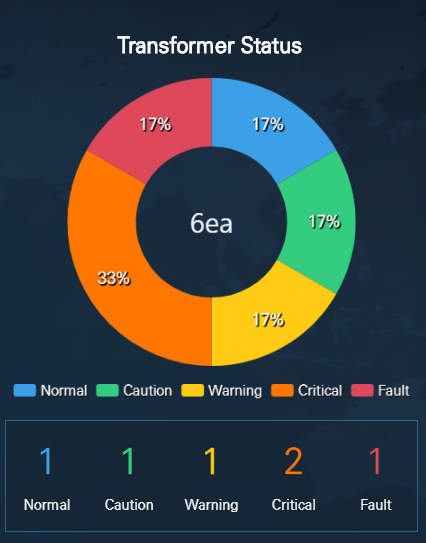
(4) Health Status Chart: The chart shows the percentage of transformers for each health status. A tool-tip window displays the number of transformers at each status. The number of all registered transformers is provided at the center of chart. In addition, the number of transformers at each status is listed under the chart.
※ Blue : (Normal status) / Green: (Caution status) / Yellow : (Warning status) / Orange : (Critical status) / Red: (Fault status).
(5) Alarm Table: This page offers a summary of alarms.
Power Transformer Monitoring
This screen offers detail information concerning the target transformer, including trend analysis, industrial AI-based diagnosis and prognosis results, and rule-based diagnosis results.
Summary Information
This function provides the latest analysis results of the transformer in brief.
(1) Function Tree: After entering the individual transformer page, the function tree is displayed at the right panel. The panel lists tools that users can select, such as summary of the transformer status, DGA Trends, AI, Rule, Similarity Analysis, and Report.

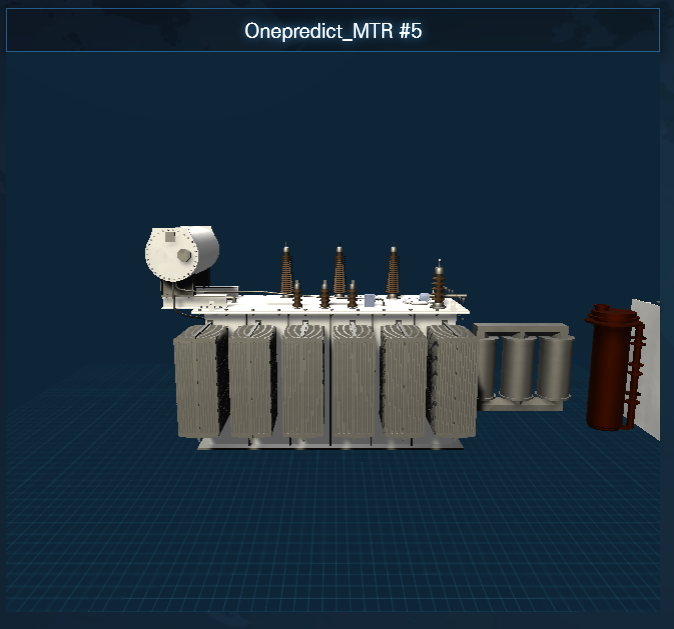
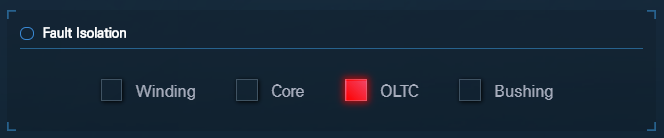
(2) Fault Isolation: The panel shows faulty components through 3D visual image. When a fault is detected on the transformer by the Industrial AI-based diagnosis algorithm, the faulty component is highlighted on the 3D model.
(3) Comprehensive Predictive Diagnosis Result: The panel summarizes the predictive diagnosis results once the measured data are uploaded.
- The results of diagnosis and prognosis are displayed based on industrial-AI methods. However, when a fault is detected or when there is less than four measurement data points, the prognosis algorithm is inactivated.
- The latest diagnosis results according to the IEEE Std C57.104TM-2008 ‘Dissolved key gas concentration limits’ diagnostics standard. Is also displayed.
- The fault mode evaluated through the IEEE Std C57.104TM-2008 (Doernenburg Ratios/Rogers Ratios) and IEC 60599:2015 (Duval Triangle 1/ Basic Gas Ratios) methods are also displayed. However, this will not be shown when the transformer is at normal status.

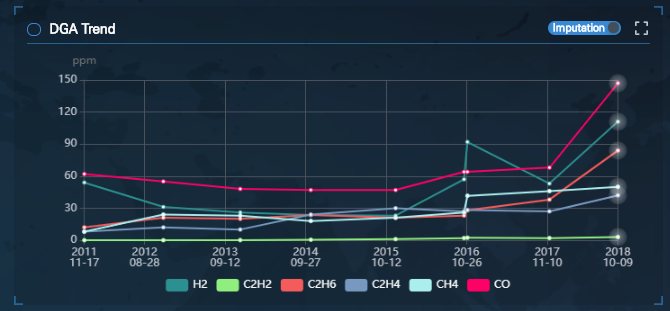
(4) DGA Trend: The panel displays the DGA gas concentration trends.
- The plotted gases are six major gases (H2, CH4, C2H2, C2H4, C2H6, CO).
- The users can choose to display or not display a gas trend by clicking the gas name on the legend.
- Users can view the values of all selected gases through a pop-up window by placing the mouse cursor on a data point.
- Users can click the On/Off button to display raw and imputation data (when there are four continuous data points for H2, CH4, C2H2, C2H4, C2H6, CO, and a data error is detected by GuardiOne®, data will be calibrated to offer industrial AI-based diagnosis and prognosis).
- Users can enlarge the plots through a pop-up window.
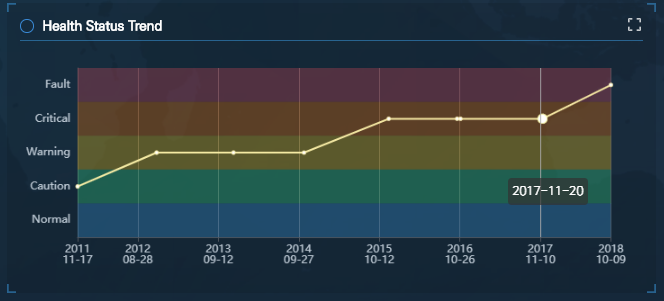
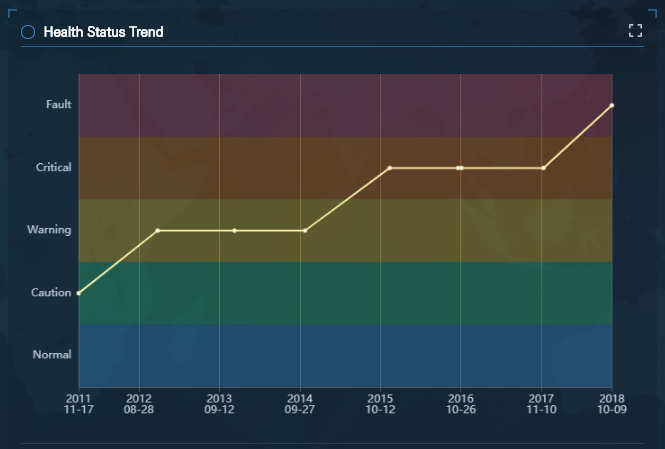
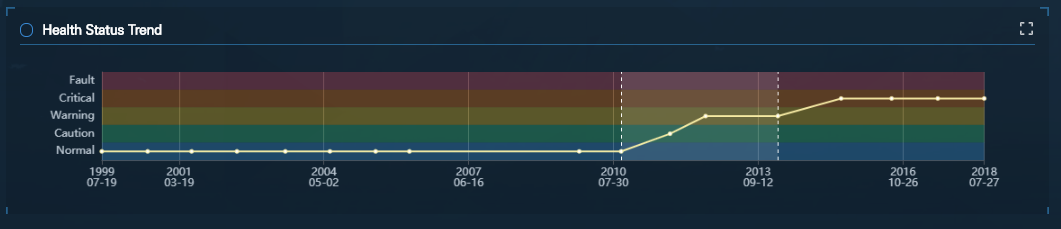
(5) Health State Trend: The panel displays the entire health status (normal, warning, critical, fault) trend of the transformer, which allows users to understand the overall changes in transformer status. When prognosis algorithm is activated, the predicted status of the transformer will be indicated with a dotted line at the end of the trend plot.
- Users can view the measurement date through a pop-up window by placing the mouse cursor on a data point.
- When prognosis algorithm is activated, the predicted status of the transformer will be indicated with a dotted line at the end of the trend plot. *Exception: If a fault is detected or when there is insufficient measurement data, prognosis results will not be displayed.
- Users can enlarge the plots through a pop-up window.
※ Blue : (Normal status) / Green: (Caution status) / Yellow : (Warning status) / Orange : (Critical status) / Red: (Fault status).
Trend Analysis
Gas Trend: This function offers Gas Concentration Trend, Key Gas Trend, Rate of Change Trend plots that represent gas characteristics.
OLTC Trend: OLTC Trend menu will be displayed if OLTC DGA data is available. This function offers Gas Concentration Trend, Key Gas Trend, Rate of Change Trend plots for OLTC DGA data.
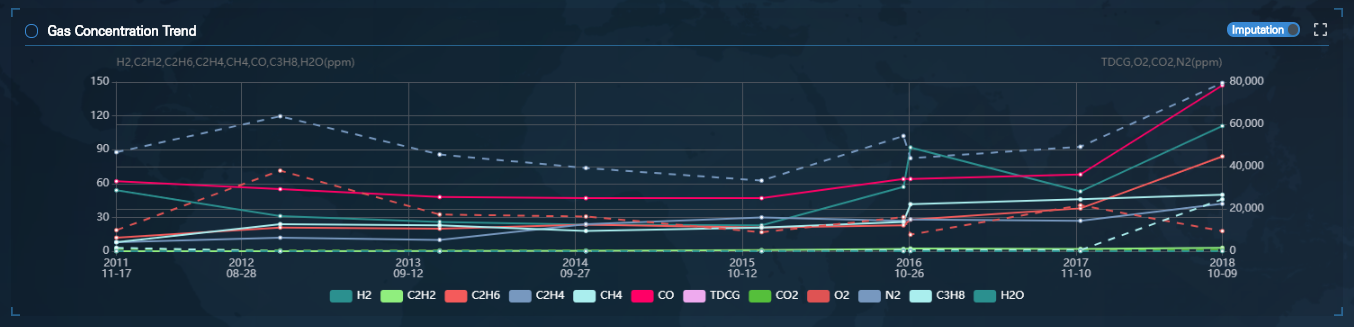
(1) Gas Concentration Trend: The panel visually provides the trend of DGA data.
- The plotted gases are H2, C2H2, C2H6, C2H4, CH4, CO, C3H8, H2O (left y axis, solid line) TDCG, CO2, O2, N2 (right y axis, dashed line).
- The users can choose to display or not display a gas trend by clicking the gas name on the legend.
- Users can view the values of all selected gases through a pop-up window by placing the mouse cursor on a data point.
- Users can click the On/Off button to display raw and imputation data (when there are four continuous data points for H2, CH4, C2H2, C2H4, C2H6, CO, and a data error is detected by GuardiOne®, data will be calibrated to offer industrial AI-based diagnosis and prognosis).
- Users can enlarge the plots through a pop-up window.
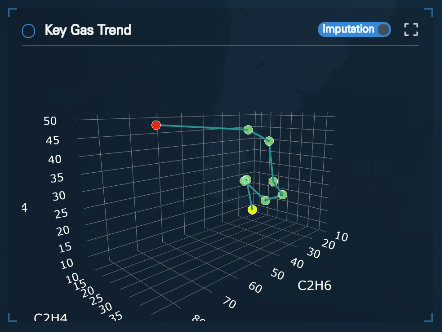
(2) Key Gas Trend: In order to make it easier for the users to understand the correlation between the three key hydrocarbon gases (CH4, C2H4, C2H6), the panel shows 3D trend plot of the three gases over time.
- The yellow and red point indicate the first and last gas data point within the setting time period.
- Users can view the values of the three gases through a pop-up window by placing the mouse cursor on a data point.
- Users can click the On/Off button to display raw and imputation data (when there are four continuous data points for H2, CH4, C2H2, C2H4, C2H6, CO, and a data error is detected by GuardiOne®, data will be calibrated to offer industrial AI-based diagnosis and prognosis).
Users can enlarge the plots through a pop-up window.
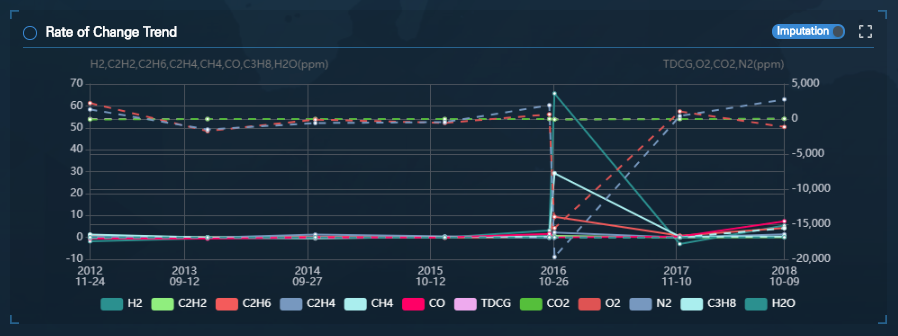
(3) Rate of Change Trend: The trend provides the rate of change of each gas between two measuring points.
- The plotted gases are H2, C2H2, C2H6, C2H4, CH4, CO, C3H8, H2O (left y axis, solid line) TDCG, CO2, O2, N2 (right y axis, dashed line).
- The value is calculated by dividing the difference in gas particles between two measuring points by the difference in months.
- The users can choose to display or not display a rate change trend of a gas by clicking the gas name on the legend.
- Users can view the rate change of all selected gases through a pop-up window by placing the mouse cursor on a data point.
- Users can click the On/Off button to display raw and imputation data (when there are four continuous data points for H2, CH4, C2H2, C2H4, C2H6, CO, and a data error is detected by GuardiOne®, data will be calibrated to offer industrial AI-based diagnosis and prognosis).
- Users can enlarge the plots through a pop-up window.
Industrial AI-based Diagnosis and Prognosis
This function provides overall diagnostic and prognostic results based on industrial AI. The dashboard displays health feature space, health state trend, the current and future health status, and fault isolation.
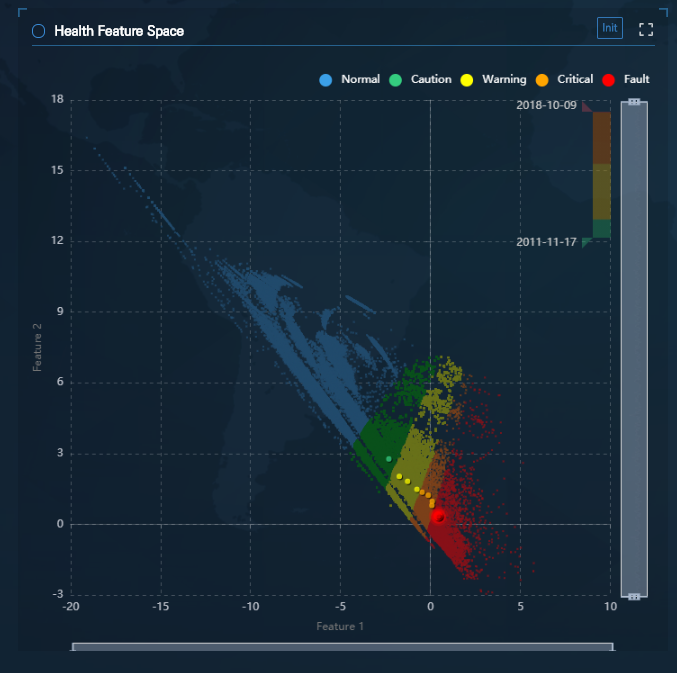
(1) Health Feature Space: The health feature space is created through two key health features derived from deep learning. This space is a diagnostic space which shows the entire trend of the health feature.
- The big points on the background data are health features of the target transformer while the highlighted point is the feature calculated with the latest DGA data.
- User can check the movement of the health feature by adjusting the color bar in the upper right corner.
- User can zoom in and out the feature space by adjusting the right vertical white bar and the lower horizontal white bar, or by using the mouse wheel button. Clicking the ‘int’ button will return the feature space to its original size.
- User can activate or deactivate specific health features by clicking the health item in the legend.
- Users can view the measurement date and gas values through a pop-up window by placing the mouse cursor on a data point.
- Users can trace the movement of feature points to check the condition of the transformers. If the latest data points are colored orange, or is close to the red section, it is recommended to check the value change carefully to protect the transformer. Even slight movement of the data point may cause catastrophic damage to the transformer – when there is abnormal operation.
※ Blue : (Normal status) / Green: (Caution status) / Yellow : (Warning status) / Orange : (Critical status) / Red: (Fault status
(2) Health State Trend: The panel provides information concerning the change history of the health status. Users can refer to the current health status through a pop-up window by placing the mouse cursor on a data point. When prognosis algorithm is active, the predicted status of the transformer one-year later is indicated by the dotted line at the end of the graph. Users can plan their maintenance strategies by referring to the prognosis results. * Exception: If a fault is detected or when there is insufficient measurement data, prognosis results will not be displayed.
- Users can enlarge the plots through a pop-up window.
※ Blue : (Normal status) / Green: (Caution status) / Yellow : (Warning status) / Orange : (Critical status) / Red: (Fault status).
(3) Diagnosis and Prognosis Result: The panel displays the results of diagnosis and prognosis with by date.

(4) Fault Isolation: The panel isolates which of the four components (Winding, OLTC, Core, and Bushing) is faulty.
* Exception: If a fault is not detected, no information will be displayed.
Rule - IEEE Std C57 104TM - 2008
This function provides DGA condition according to the rule-based method ‘IEEE Std C57.104TM-2008 - dissolved key gas concentration limits’.
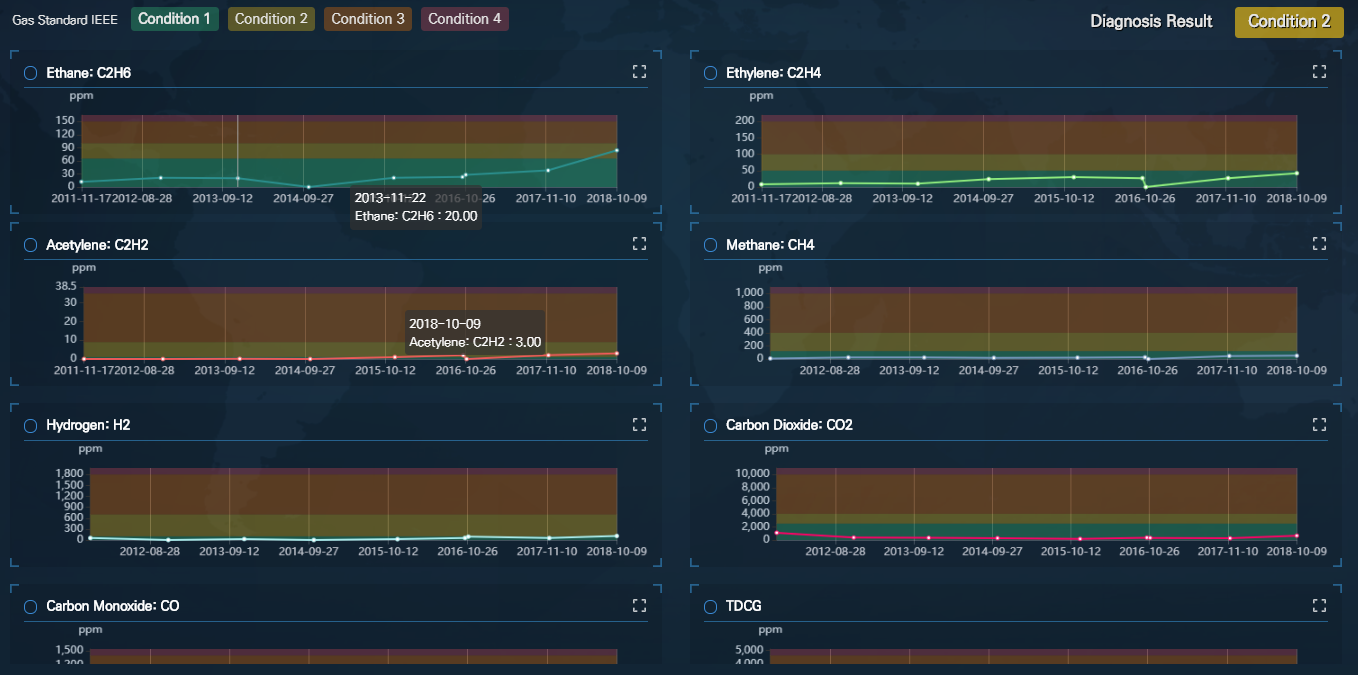
The page displays the trends of each gas and the total gas volume in charts (H2, CH4, C2H2, C2H4, C2H6, CO, CO2, TDCG).
- The thresholds for each gas and TDCG are provided so that users can easily review which status the target gas is at.
TDCG: Total Dissolved Combustible Gas Volume. The TDCG value does not include CO which is not a combustible gas. - Gas values are displayed through a pop-up window when users place their cursor over the different charts.
- The diagnosis result is indicated at the upper right.
- When users place the cursor on the diagnosis result, the corresponding standard from IEEE Std C57.104TM-2008 is indicated through a pop-up window .
- Users can enlarge the plots through a pop-up window.
※ Green : (Condition 1) / Yellow : (Condition 2) / Orange : (Condition 3) / Red : (Condition 4)
Rule - IEC 60599 - 2015
This function provides DGA condition according to the rule-based method ‘IEC 60599:2015 - Ranges of 90% Typical Gas Concentration Values Observed in power transformers’.
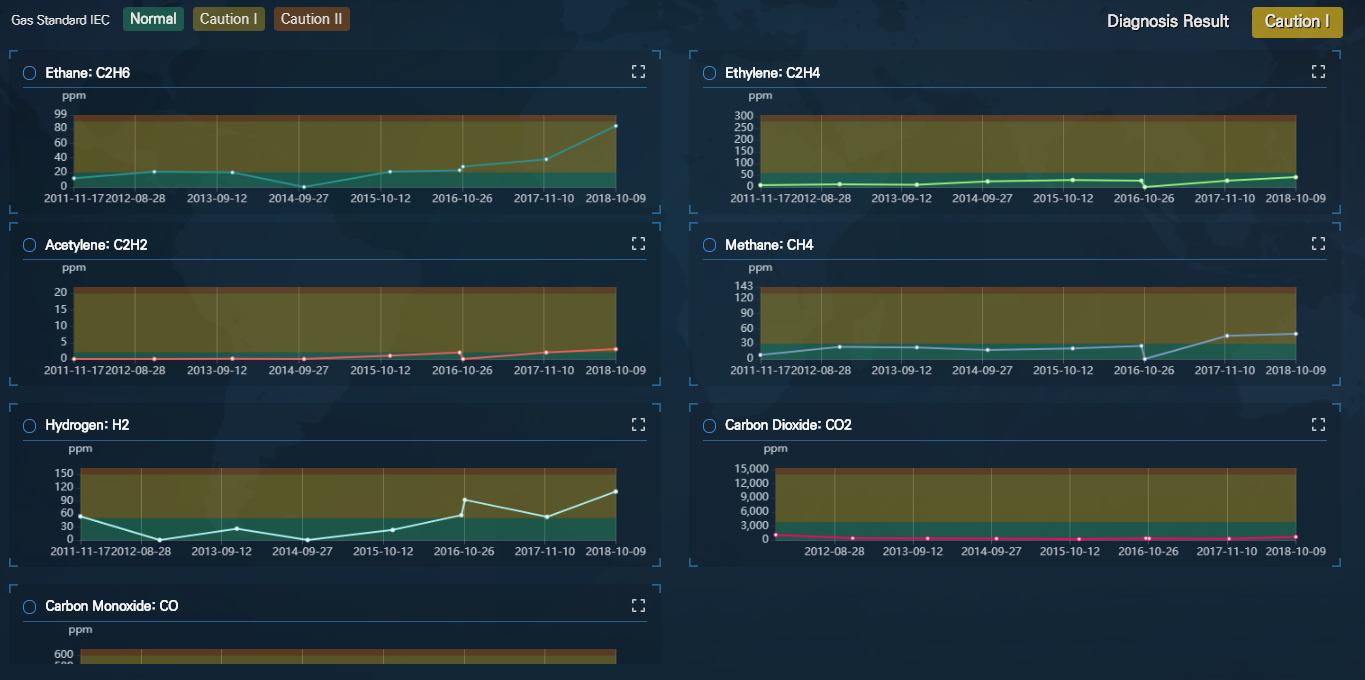
The page displays the trends of each gas in charts (H2, CH4, C2H2, C2H4, C2H6, CO, CO2).
- The thresholds for each gas are provided so that users can easily review which status the target gas is at.
- Gas values are displayed through a pop-up window when users place their cursor over the different charts.
- The diagnosis result is indicated at the upper right.
- When users place the cursor on the diagnosis result, the corresponding standard from IEC 60599:2015 is indicated through a pop-up window.
- Users can enlarge the plots through a pop-up window.
※ Green : (Normal) / Yellow : (Caution Ⅰ) / Orange : (Caution Ⅱ)
Rule - JAPAN ETRA
This function provides DGA condition according to the rule-based method ‘IEC 60599:2015 - Ranges of 90% Typical Gas Concentration Values Observed in power transformers’.
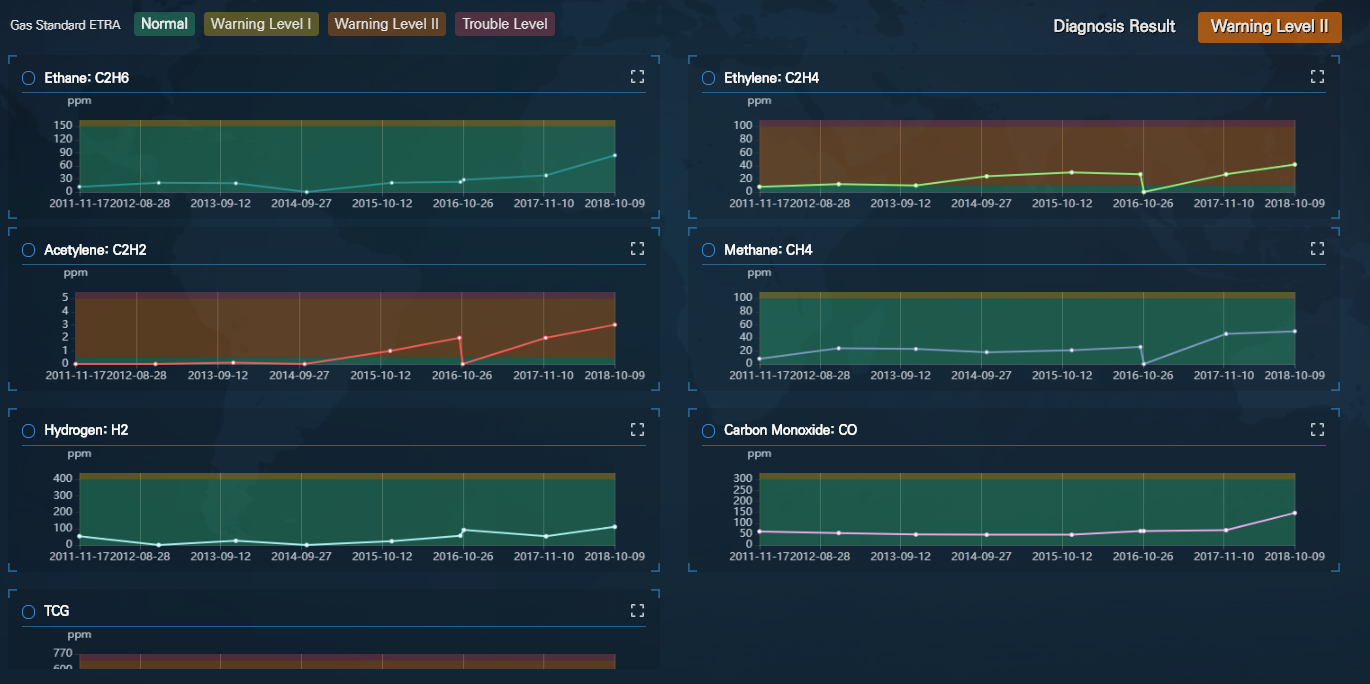
The page displays the trends of each gas and the total gas volume in charts (H2, CH4, C2H2, C2H4, C2H6, CO, TCG).
* TCG = (H2 + CH4 + C2H6 + C2H4 + C2H2 + CO)
- The thresholds for each gas and TCG* are provided so that users can easily review which status the target gas is at.
- Gas values are displayed through a pop-up window when users place their cursor over the different charts.
- The diagnosis result is indicated at the upper right.
- When users place the cursor on the diagnosis result, the corresponding standard from JAPAN ETRA is indicated through a pop-up window.
- Users can enlarge the plots through a pop-up window.
※ Green : (Normal) / Yellow : (Warning Level Ⅰ) / Orange : (Warning Level Ⅱ) / Red : (Trouble Level )
Rule - Duval Triangle 1
‘Duval Triangle 1’ is a method to evaluate possible fault types and fault modes as specified in ‘IEC 60599 – Mineral oil-filed electrical equipment in service – Guidance on the interpretation of dissolved and free gases analysis’. The method can be used when the AI detects that the transformer state is at a worse level than ‘caution’.
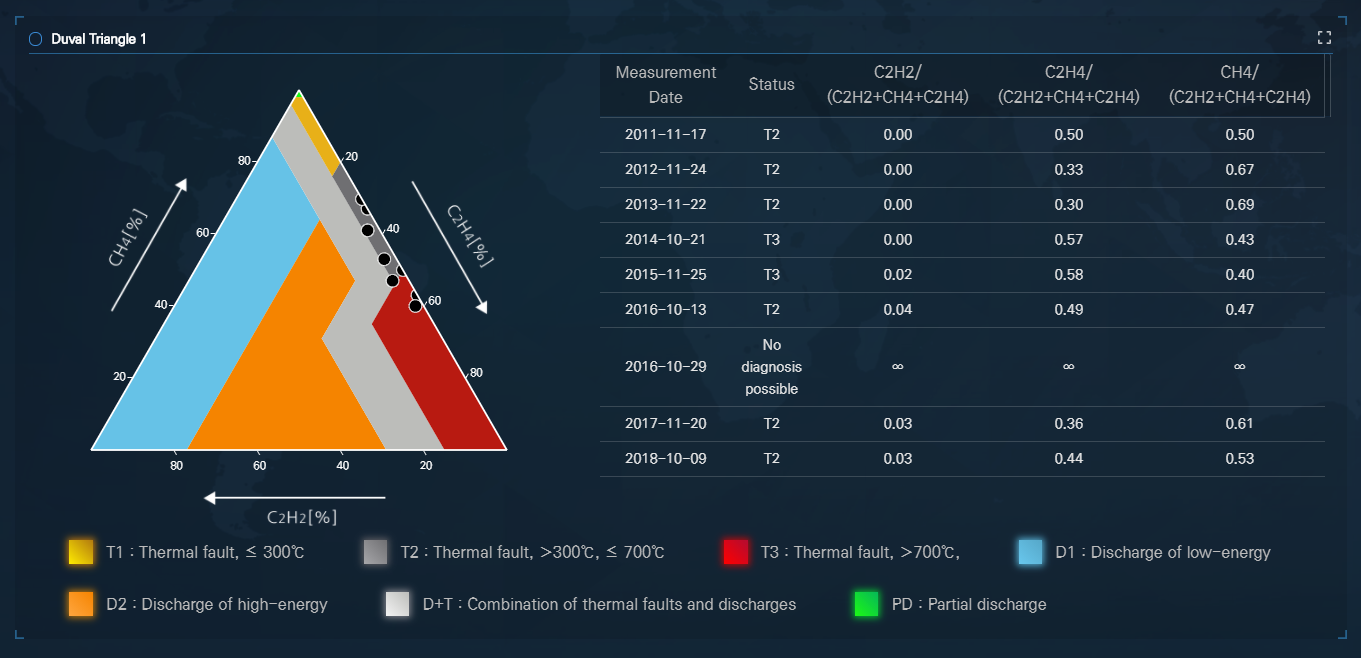
- Concentrations (ppm) of CH4, C2H4, and C2H2 are shown as percentages of the total (CH4+C2H4+C2H2). The percentages (%CH4, %C2H4, %C2H2) are plotted on the triangular coordinate system, which specifies different fault zones. The location of the gas percentage data points designates the fault type. The legend (square boxes in color) below the Duval Triangle lists the fault mode.
- When users place the cursor on a data point, the measurement date, fault mode and the percentage values of the three gases are indicated through a pop-up window.
- The measurement date, fault mode and gas composition ratios are provided in a table chart, for easy access to the data.
- Users can enlarge the plots through a pop-up window.
Rule - Doernenburg and Rogers Ratios
(1) Doernenburg Ratios: Doernenburg Ratios is a method to evaluate possible fault types and fault modes as specified in ‘IEEE Std C57.104TM-2008 - IEEE Guide for the Interpretation of Gases Generated in Oil-Immersed Transformers’. The method can be used when the AI detects that the transformer state is at a worse level than ‘caution’. The fault modes provided by Doernenburg Ratios are ‘Thermal Decomposition’, ‘Partial Discharge (low-intensity PD)’ and ‘Arcing (high-intensity PD)’.
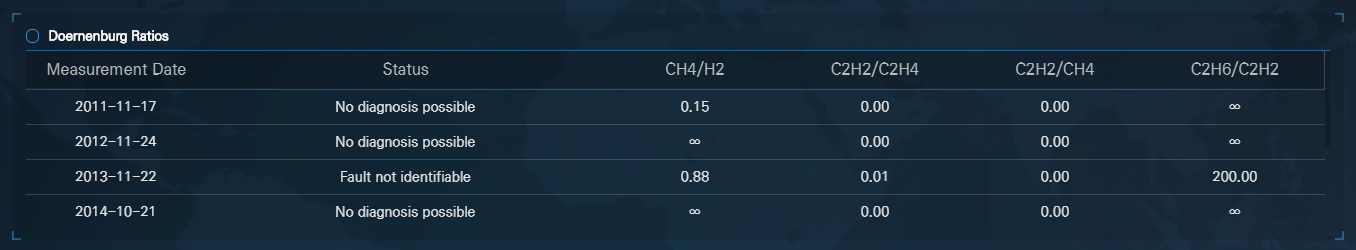
- R1 (Ratio1, CH4/H2), R2 (Ratio2, C2H2/C2H4), R3 (Ratio3, C2H2/CH4), R4 (Ratio4, C2H6/C2H2) data are compared to thresholds, to identify the corresponding fault mode.
- The measurement date, fault mode and gas composition ratios are provided in a table chart, for easy access to the data.
- If the denominator gas value of any of four gas composition ratios is 0, the status will be displayed as ‘No diagnosis possible’. In addition, if the fault mode cannot be identified, the status will be displayed as ‘Fault not identifiable’.
(2) Rogers Ratios: Rogers Ratios is a method to evaluate possible fault types and fault modes as specified in ‘IEEE Std C57.104TM-2008 -IEEE Guide for the Interpretation of Gases Generated in Oil-Immersed Transformers’. The method can be used when the AI detects that the transformer state is at a worse level than ‘caution’.
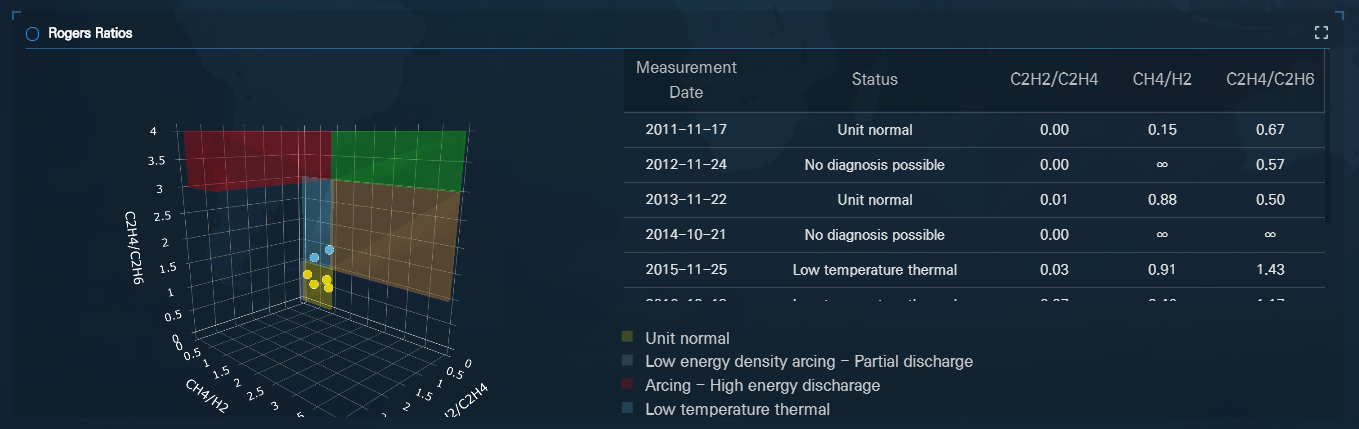
- R1 (Ratio1, C2H2/C2H4), R2 (Ratio2, CH4/H2), R5 (Ratio5, C2H4/C2H6) data are compared to thresholds, to identify the corresponding fault mode. The legend (square boxes in color) next to the 3D plot lists the fault modes provided by Rogers Ratios. The location of the data point equates to the fault mode.
- When users place the cursor on a fault mode point in the 3D plot, the measurement date, fault mode and the three gas values are displayed through a pop-up window.
- The measurement date, fault mode and gas composition ratios are provided in a table chart, for easy access to the data.
- If the denominator gas value of any of four gas composition ratios is 0, the status will be displayed as ‘No diagnosis possible’. In addition, if the fault mode cannot be identified, the status will be displayed as ‘Fault not identifiable’.
- Users can enlarge the plot through a pop-up window.
Rule - Basic Gas Ratios
Basic Gas Ratios is a method to evaluate possible fault types and fault modes as specified in ‘IEC 60599 – Mineral oil-filed electrical equipment in service – Guidance on the interpretation of dissolved and free gases analysis’. The method can be used when the AI detects that the transformer state is at a worse level than ‘caution’.
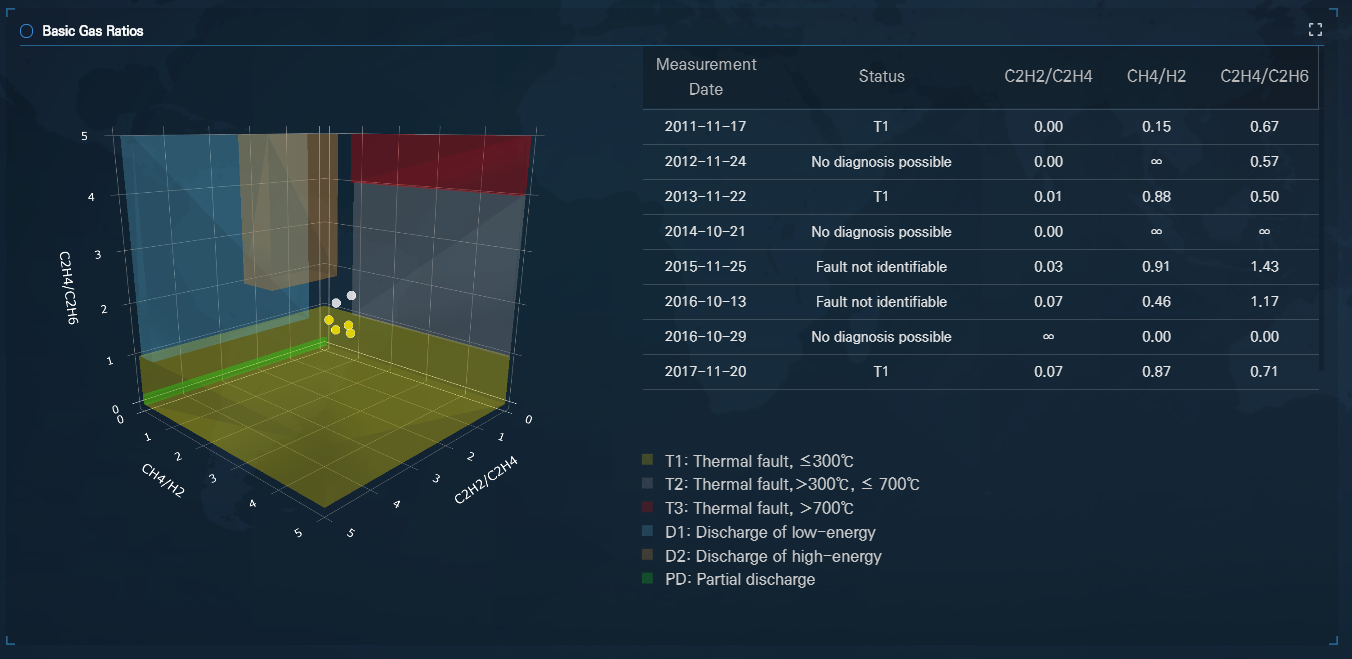
- R1 (Ratio1, C2H2/C2H4), R2 (Ratio2, CH4/H2), R5 (Ratio5, C2H4/C2H6) data are compared to thresholds, to identify the corresponding fault mode. The legend (square boxes in color) next to the plot lists the fault modes provided by Basic Gas Ratios. The location of the data point equates to the fault mode.
- When users place the cursor on a fault mode point in the 3D plot, the measurement date, fault mode and the three gas values are displayed through a pop-up window.
- The measurement date, fault mode and gas composition ratios are provided in a table chart, for easy access to the data.
- If the denominator gas value of any of four gas composition ratios is 0, the status will be displayed as ‘No diagnosis possible’. In addition, if the fault mode cannot be identified, the status will be displayed as ‘Fault not identifiable’. .
- Users can enlarge the plot through a pop-up window.
Similarity Trend Analysis
This function provides users with insights for predictive maintenance of transformers by presenting analysis of the most similar transformer. * Exception: Similarity analysis will not be activated if there is insufficient data.
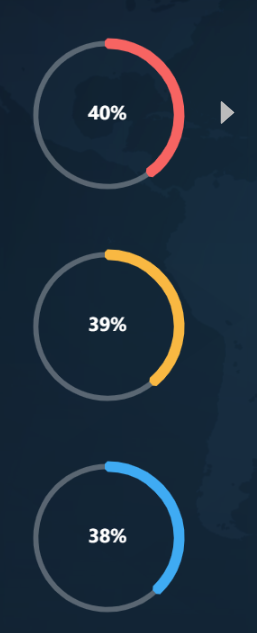
(1) DGA Similarity Chart: This chart displays the data of the top three most similar transformers. By clicking each transformer, the transformer’s Analysis Table, DGA Trend, Health Status Trend will be displayed.
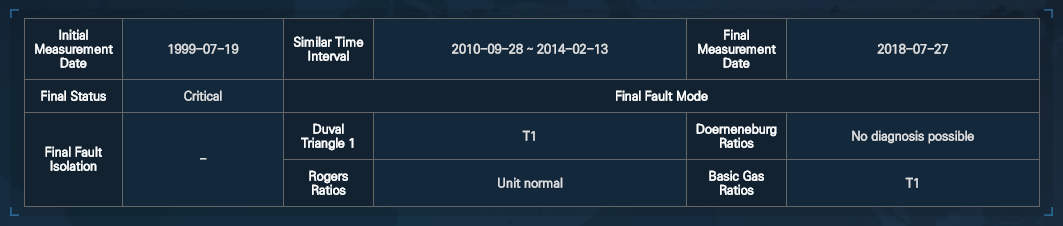
(2) Analysis Table: This table provides all status information of the similar transformer.
- Information such as initial measurement date, similar time interval of targeted transformer, final measurement date, health status of final measurement date will be displayed.
- If the last diagnosis result is worse than caution, the fault mode – through Duval Triangle 1, Doernenburg Ratios, Rogers Ratios, Basic Gas Ratios analysis – will be displayed.
- If a fault is detected, the faulty component will be indicated in the table.
- The final status of the similar transformer can offer insight to the users in that the user’s transformer will likely follow status trend of the similar transformer.
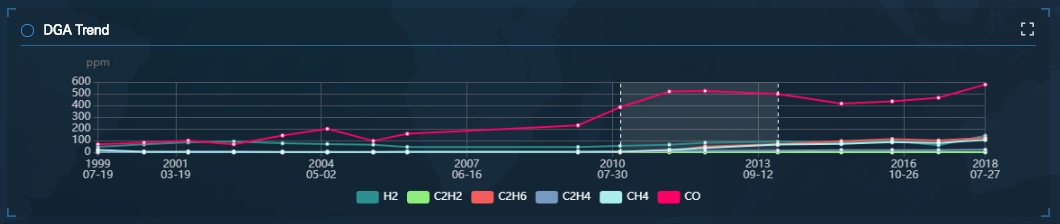
(3) DGA Trend: This plot provides the main DGA gas concentration trends of similar transformer.
- The plotted gases are six major gases (H2, CH4, C2H2, C2H4, C2H6, CO).
- The highlighted white translucent background section is the most similar section.
- The users can choose to display or not display the gas trend by clicking the gas name on the legend.
- Users can view the rate change of all selected gases through a pop-up window by placing the mouse cursor on a data point.
- Users can enlarge the plots through a pop-up window.
(4) Health Status Trend: This plot provides the health status trend for the similar transformers.
- The highlighted white translucent background section is the most similar section.
- Users can view the measurement date through a pop-up window by placing the mouse cursor on a data point.
- Users can enlarge the plots through a pop-up window.
※ Blue : (Normal status) / Green: (Caution status) / Yellow : (Warning status) / Orange : (Critical status) / Red: (Fault status).
Status Analysis Report
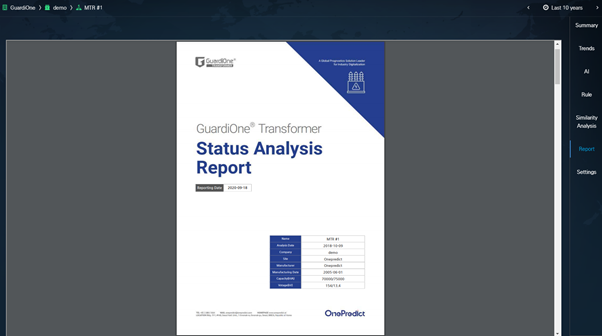
The analysis report of the corresponding transformer is provided automatically. The analysis contents included in the report are as follows.
- 1 Page: Target transformer information
- 2 Page: Latest DGA value, Status Analysis Result, Action Plan
- 3 Page: DGA Condition - IEEE Std C57.104-2008, IEC 60599:2015, JAPAN ETRA (latest DGA value)
- 4 Page: DGA Trend
- 5 Page: Health Status Trend, Health Feature Space (latest feature value)
- 6 Page: Rule – Duval Triangle 1, Doernenburg Ratios (latest fault mode)
- 7 Page: Rule – Roger Ratios, Basic Gas Ratios (latest fault mode)
- 8 Page: Similarity Analysis – Analysis tables of most similar three transformers In addition, file rotation, download, print, and resizing functions are also provided.