Release Notes
v.1.1 - October 2020
In GuardiOne v.1.1, the following features have been modified:
Asset
Transformer Information List
- Data fields for asset management have been modified: transformer name, register date, site, voltage(kV), capacity, manufacturer, manufacturing date, and operating date.
DGA Data Management
- Data upload and download features have been added.
- The data input window will pop up when the user clicks the upload icon. Users can manually enter data in the data entry window.
- Users can download all DGA data for a specific transformer. Users can click the download icon to download the data in csv file format.
Alarm
- Data fields for alarm table have been modified: analysis date, diagnostic status, prognostic status, corresponding possible faults and findings through gas value comparison, and recommended analysis date
- User can change the sorting sequence by clicking the upper and lower triangle icons within the diagnosis/prognosis data fields.
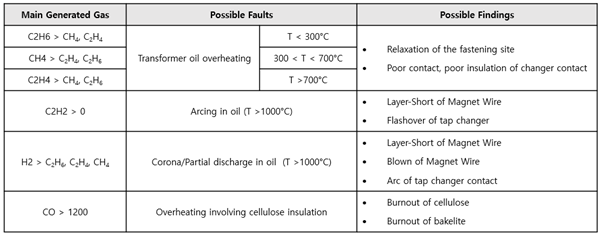
Presentation of Possible Faults and Causes
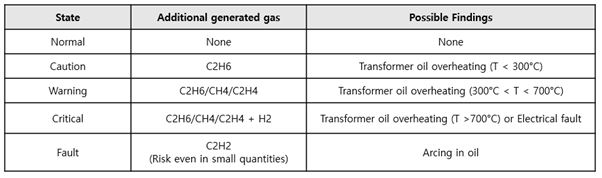
- In cases where the diagnosis status is at ‘warning’ or at a worse level, possible faults and causes are presented based on the table below.
* The table below refers to KEPCO's “Substation Facility Prevention Diagnosis Standard” based upon the main generated gas.
Recommended analysis date for each diagnosis state
The following analysis periods are based upon KEPCO’s “Substation Facility Prevention Diagnosis Standard”.
- Normal: Next DGA analysis after 12 months
- Caution: Next DGA analysis after 6 months
- Warning: Next DGA analysis after 3 months
- Critical: Next DGA analysis after 1 months
- Fault: Immediate maintenance required
* The following measures are recommended by referring to the “Substation Facility Prevention Diagnosis Standard” of KEPCO.
Power Substation Monitoring
Health Status Chart
- The levels for transformer health status have increased from an existing 4 levels to 5 levels.
Alarm Table
- User can now change the sorting sequence by clicking the upper and lower triangle icons within the diagnosis/prognosis data fields.
Summary Information
Function Tree
- The similarity analysis tab is now independent from the trend tab, while a report tab has been added.
3D Model Image
- The graphics of the 3D model has been improved. It is now more realistic than the previous version.
Comprehensive Predictive Diagnosis Result
- Users can now evaluate fault modes through the IEEE Std C57.104TM-2008 (Doernenburg Ratios/Rogers Ratios).
DGA Trend
- Users can enlarge the plots through a pop-up window.
- Users can click the On/Off button to display raw and imputation data (when there are four continuous data points for H2, CH4, C2H2, C2H4, C2H6, CO, and a data error is detected by GuardiOne®, data will be calibrated to offer industrial AI-based diagnosis and prognosis).
Industrial AI-based Diagnosis and Prognosis - Health Feature Space / Health State Trend
-
‘Caution’ level added to further segment AI-based diagnosis statuses (v1.1 diagnosis states: Normal, Caution, Warning, Critical, Fault)
-
Machine learning clustering algorithm and health feature space trend analysis used to understand the diagnostic status of transformers with improved reliability
-
Retraining of the AI-based prediction algorithms – due to the addition of the diagnosis status level ‘Caution’
-
3.47% increase in AI-based predictive model performance and 56.56% decrease in predicted false diagnosis rate
Basis for diagnosis
-
Based on a data driven method, each state is determined according to the cluster of data.
-
Additional gas is generated according to each state cluster, and the main abnormality types for each state are as listed in the table below.
Rule - Duval Triangle 1 / Doernenburg and Rogers Ratios / Basic Gas Ratios
- The measurement date, fault mode and gas composition ratios are provided in a table chart, for easy access to the data.
- Users can enlarge the plots through a pop-up window.
Similarity Trend Analysis
DGA Similarity Chart
This chart displays the data of the top three most similar transformers. By clicking each transformer, the transformer’s Analysis Table, DGA Trend, Health Status Trend will be displayed.
Analysis Table
- Information such as initial measurement date, similar time interval of targeted transformer, final measurement date, health status of final measurement date will be displayed.
- If the last diagnosis result is worse than caution, the fault mode – through Duval Triangle 1, Doernenburg Ratios, Rogers Ratios, Basic Gas Ratios analysis – will be displayed.
- The final status of the similar transformer can offer insight to the users in that the users’ transformers will likely follow the status trend of the similar transformer.
DGA Trend & Health Status Trend
- The plotted gases are the six major gases (H2, CH4, C2H2, C2H4, C2H6, CO).
- The highlighted white translucent background section is the most similar section.
OLTC Trend
OLTC Trend menu will be displayed if OLTC DGA data is available. This function offers Gas Concentration Trend, Key Gas Trend, Rate of Change Trend plots for OLTC DGA data.
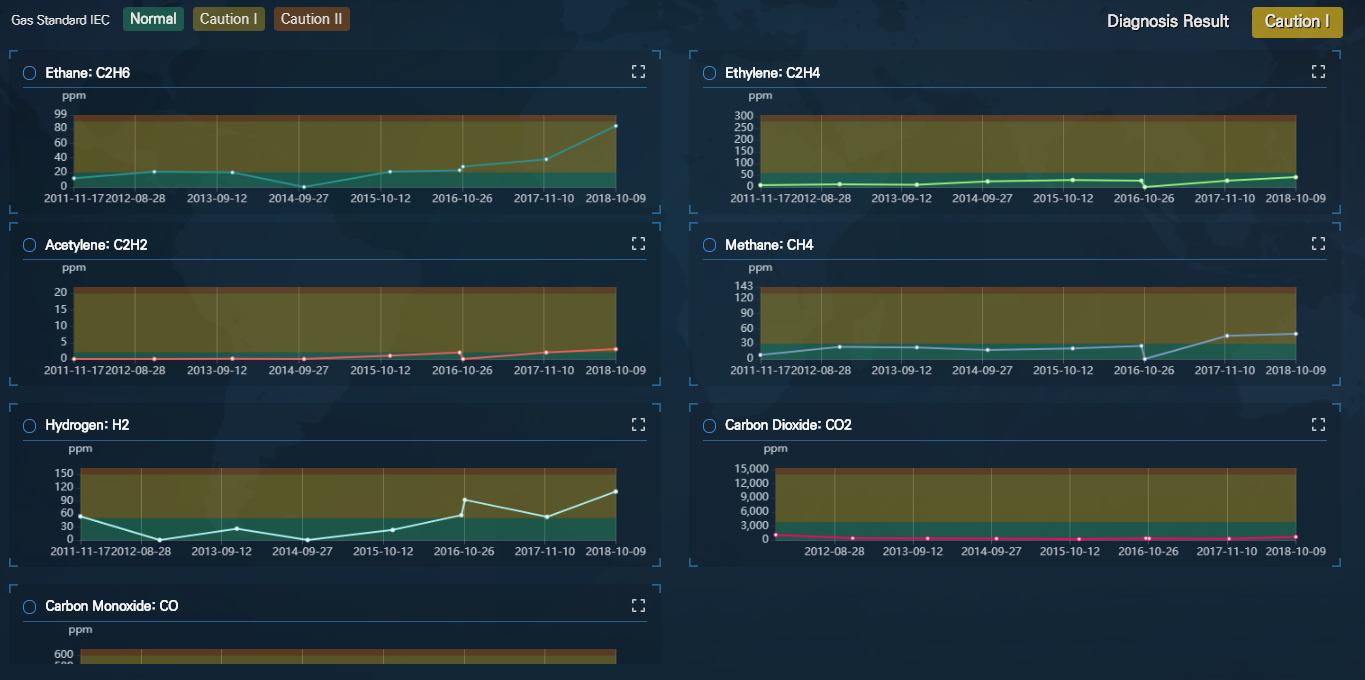
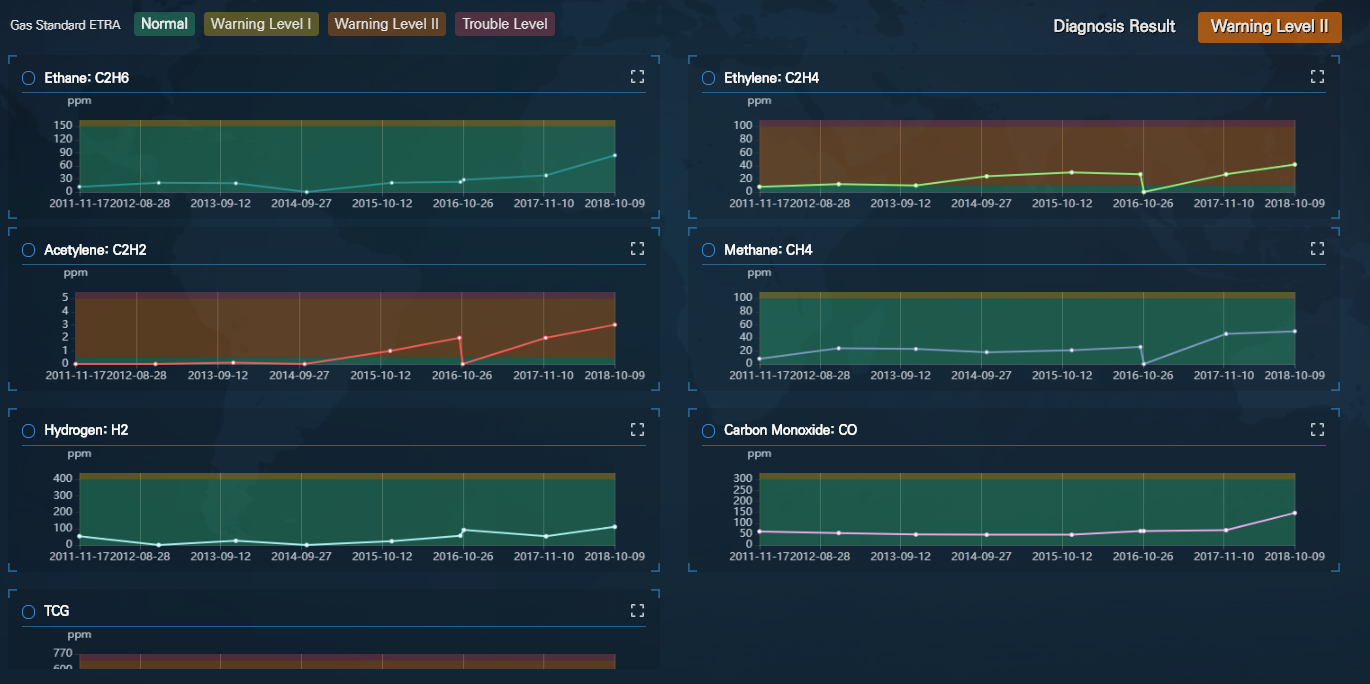
Rule - IEC 60599 - 2015 & JAPAN ETRA
- This function provides DGA condition according to the rule-based method ‘IEC 60599:2015 - Ranges of 90% Typical Gas Concentration Values Observed in power transformers’ and the ‘JAPAN ETRA - Judgment Criteria of Three Level’.
- The thresholds for each gas and TCG are provided so that users can easily review which status the target gas is at.
TCG = (H2 + CH4 + C2H6 + C2H4 + C2H2 + CO) - Gas values are displayed through a pop-up window when users place their cursor over the different charts.
- The diagnosis result is indicated at the upper right.
- When users place the cursor on the diagnosis result, the corresponding standard from IEC 60599:2015 or JAPAN ETRA is indicated through a pop-up window.
- Users can enlarge the plots through a pop-up window.
Status Analysis Report
The analysis report of the corresponding transformer is provided automatically. The analysis contents included in the report are as follows.
- 1 Page: Target transformer information
- 2 Page: Latest DGA value, Status Analysis Result, Action Plan
- 3 Page: DGA Condition - IEEE Std C57.104-2008, IEC 60599:2015, JAPAN ETRA (latest DGA value)
- 4 Page: DGA Trend
- 5 Page: Health Status Trend, Health Feature Space (latest feature value)
- 6 Page: Rule – Duval Triangle 1, Doernenburg Ratios (latest fault mode)
- 7 Page: Rule – Roger Ratios, Basic Gas Ratios (latest fault mode)
- 8 Page: Similarity Analysis – Analysis tables of most similar three transformers. In addition, file rotation, download, print, and resizing functions are also provided.